Bet Distribution Curves Reveal Player Patterns in Hybrid Reel and Table Gaming on British Platforms
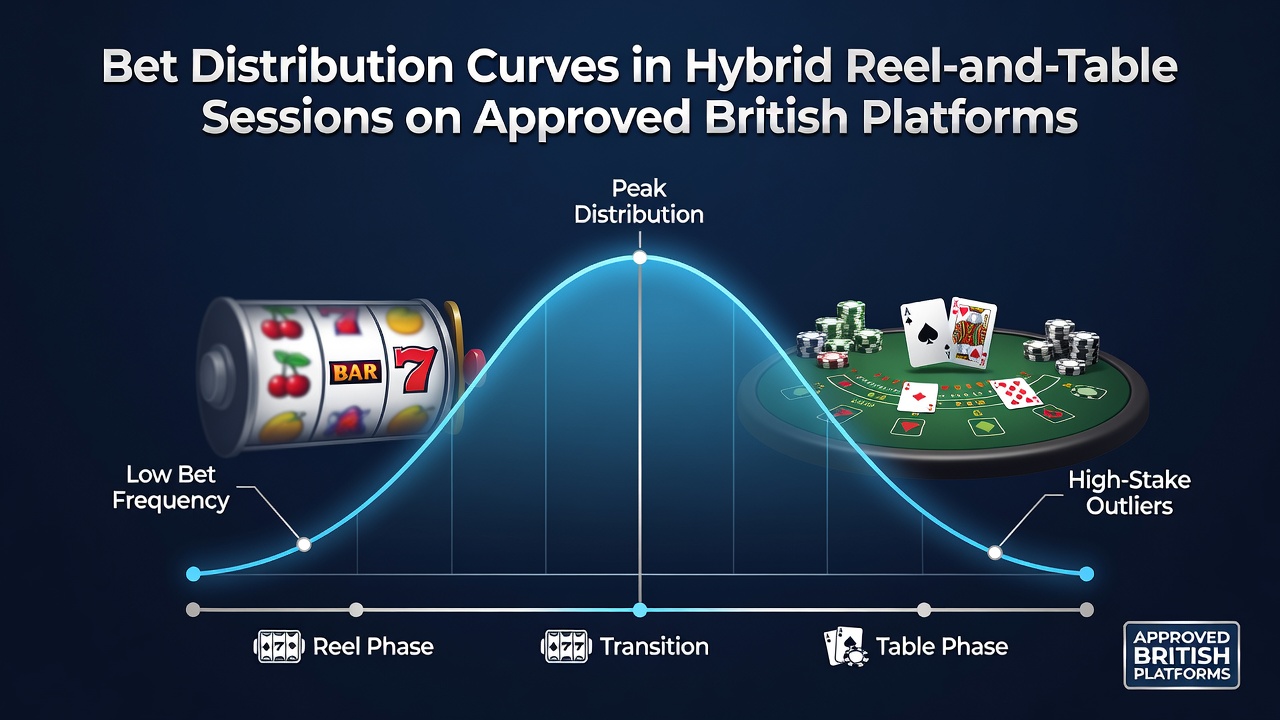
Bet distribution curves track how wager sizes spread across individual sessions that combine reel-based slots with table games such as blackjack and roulette on licensed British platforms. These curves map the frequency and size of bets placed over time and show distinct shapes when players switch between game types within a single visit. Observers note that hybrid sessions produce smoother bell-shaped curves compared with the sharper peaks often seen in pure slot play or the steadier plateaus common in extended table sessions.
Defining the Curves in Mixed Play
Researchers at several European gaming institutes have examined transaction logs from approved operators and found that bet sizes in hybrid formats tend to cluster around mid-range amounts after the first 15 minutes of play. Data indicates players often start with smaller reel bets then gradually increase stakes when they move to table games before settling back to moderate levels. This pattern creates a broader distribution than either format produces alone and reflects the pacing differences between automated reel spins and dealer-paced table decisions.
Figures from platform analytics in early 2026 showed that 62 percent of hybrid sessions featured at least three distinct bet-size tiers while single-format sessions rarely exceeded two tiers. The additional tier usually appears during the transition between reels and tables when players adjust their risk exposure based on recent outcomes.
Patterns Emerging in July 2026 Data
Platform reports compiled through July 2026 confirm that hybrid sessions lasting between 45 and 90 minutes display the most pronounced central clustering on the distribution curve. Shorter visits under 30 minutes generate steeper initial rises followed by rapid drops while longer sessions flatten the curve through repeated small adjustments. Analysts tracking these logs note the July figures align with earlier quarterly trends yet reveal a slight widening of the mid-range band during summer months when session lengths increase across the sector.

Comparative Insights from Other Jurisdictions
Similar distribution patterns appear in data released by the Nevada Gaming Control Board where operators have tracked mixed reel and table activity for several years. Those records show comparable mid-session clustering although the absolute bet amounts sit higher due to different regulatory minimums. A separate study published by the University of Sydney's Gambling Research Unit examined Australian venue logs and identified the same three-tier structure in hybrid play confirming the pattern holds across markets with strict licensing frameworks.
Operators on British platforms use these curves to calibrate automated responsible gambling tools that flag unusual spikes outside the expected distribution range. When a session curve deviates sharply from the established hybrid template systems trigger a review without interrupting play. This approach relies on historical aggregates rather than individual prediction and maintains compliance with existing codes of practice.
Operational Adjustments and Reporting
Platform teams adjust game sequencing prompts based on curve data to encourage smoother transitions between reel and table sections. For example some sites now display suggested bet ranges that mirror the mid-tier cluster observed in completed hybrid sessions. These prompts appear only after the first reel round and before table entry helping players maintain the distribution profile without direct instruction.
Industry associations such as the European Gaming and Betting Association have begun collecting anonymised curve datasets from member operators to support cross-border comparisons. The July 2026 collection round included hybrid session metrics from multiple jurisdictions and preliminary summaries indicate the British platform curves fall within the European average range for both width and peak location.
Conclusion
Bet distribution curves provide operators and regulators with a measurable view of how wager behaviour evolves when players combine reel and table formats on approved British platforms. The patterns documented through 2026 show consistent central clustering in mid-length sessions and align with observations from other regulated markets. Continued aggregation of these datasets supports operational refinements while preserving the factual record of play dynamics across licensed environments.